RQEAX RQEIX RQECX
The RESQ Dynamic Allocation Fund seeks long term capital appreciation with capital preservation as a secondary objective. The Fund seeks to achieve its investment objectives by investing, either directly or indirectly through a portfolio of exchange traded funds that invest in foreign and domestic equity securities, fixed income securities and commodities of any market capitalization. The Fund seeks a positive return through all market cycles by tactically moving among cash and security positions based upon prevailing market conditions. The Fund may be concentrated in certain sectors from time to time. The Fund's advisor will select the appropriate allocation to achieve the Fund’s objectives based on its proprietary model.
There is no guarantee that any investment strategy will achieve its objectives, generate profits or avoid losses.


The Dynamic Allocation Fund strives to participate in the upside of the MSCI World Index, while retaining the ability to get defensive during times of market stress. The Fund can invest in large, mid and small cap stocks. The Fund can also invest in any of the nine S&P 500 sectors. We added bonds, commodities and cash to the models so the fund can seek to get defensive during market corrections, thus potentially reducing risk and volatility. The portfolios are built with specific risk characteristics to provide the opportunity for risk-adjusted returns to shareholders. This involves the use of a mathematical optimization approach to construct a portfolio with the highest opportunity for returns with a targeted amount of portfolio risk. The Quant model will then use a mathematical algorithm to rank securities and provide a well-diversified mix, suitable for that particular market cycle. Each asset class strategy is reviewed daily, weekly or monthly. Hold periods are staggered to allow constant adjustments in the fund throughout the year. This will allow for quick reactions to market changes.
| NAV | NAV Daily Change | % Daily Change | % YTD Return | One Month | Three Months | Six Month |
|---|---|---|---|---|---|---|
| NAV11.70 | NAV Daily Change0.02 | % Daily Change0.17% | % YTD Return7.64% | 1 Month3.13% | 3 Months7.49% | 6 Months6.27% |
| Max Sales Charge | 1 Month-2.78% | 3 Month1.35% | 6 Month0.18% | |||
| One Year Through 3/31/2026 | Five Year THROUGH 3/31/2026 |
Since Inception |
|
|---|---|---|---|
| 15.81 % | 3.36 % | 2.32 % | |
| Max Sales Charge | 9.20 % | 2.14 % | 1.83 % |
5.75% Max Sales Charge on Class A Shares. The performance data quoted here represents past performance. Current performance may be lower or higher than the performance data quoted above. Past performance is no guarantee of future results. The investment return and principal value of an investment will fluctuate so that investor's shares, when redeemed, may be worth more or less than their original cost. For performance information current to the most recent month-end, please call toll free 877-940-2526.
The Fund's adviser, RESQ Investment Partners, LLC (the “Adviser”) has contractually agreed to waive management fees and to make payments to limit Fund expenses, at least until February 1, 2027, so that the total annual fund operating expenses (excluding (i) any front-end or contingent deferred loads; (ii) brokerage fees and commissions; (iii) acquired fund fees and expenses, (iv) borrowing costs (such as interest and dividend expenses on securities sold short); (v) taxes; and (vi) extraordinary expenses, such as litigation expenses (which may include indemnification of Fund officers and Trustees, contractual indemnification of Fund service providers (other than the Adviser))) of the Fund do not exceed 2.20%, 1.80% and 2.80% of average daily net assets attributable to Class A, Class I, and Class C shares, respectively. These fee waivers and expense reimbursement are subject to possible recoupment from the Fund within three years after the fees have been waived or reimbursed, if such recoupment can be achieved within the lesser of the foregoing expense limits or the expense limits in place at the time of recapture. These agreements may be terminated only by the Board of Trustees on 60 days’ written notice to the Adviser.
As of:
3/31/26
| Security Description | Percentage |
|---|---|
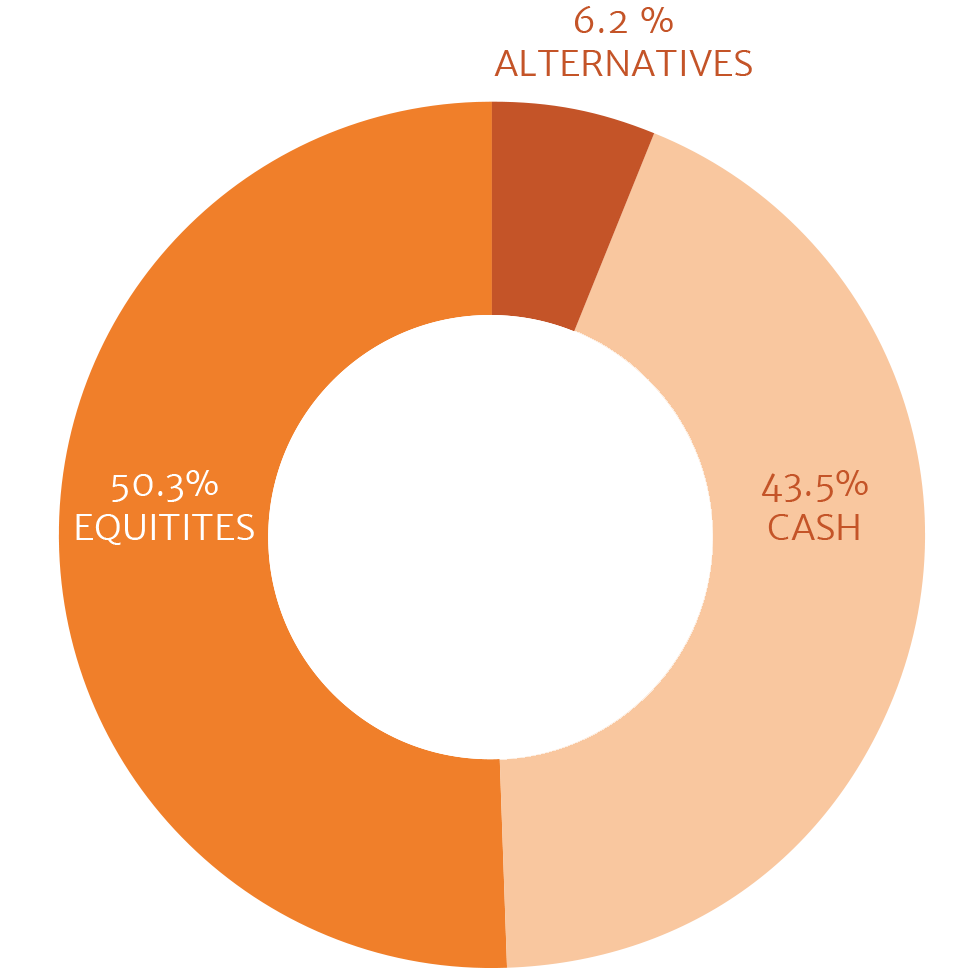
| Desc. FRST AM-GV OB-X | % 43.54% |
| Desc. ISHARES MSCI ACW | % 10.63% |
| Desc. SS TECH SEL SECT | % 8.48% |
| Desc. VANGUARD S&P 500 | % 6.75% |
| Desc. DI DA SE BE 3E-U | % 4.57% |
| Desc. SS FINANCIAL SEL | % 3.65% |
| Desc. SS CONSUMER DISC | % 3.02% |
| Desc. SS HEALTH CARE | % 3.01% |
| Desc. ISHARES US UTILI | % 2.98% |
| Desc. SS INDUSTRIAL | % 2.69% |
| Share Class | Ticker | CUSIP | Gross Expense Ratio | Net Expense Ratio |
|---|---|---|---|---|
| Share ClassA | TickerRQEAX | CUSIP66538E291 | GER2.80% | Net Expense Ratio2.56% |
| Share ClassI | TickerRQEIX | CUSIP66538E267 | GER2.40% | Net Expense Ratio2.16% |
| Share ClassC | TickerRQECX | CUSIP66538G718 | GER3.40% | Net Expense Ratio3.16% |