RQIAX RQIIX RQICX
The RESQ Strategic Income Fund seeks to provide income, with an emphasis on total return and capital preservation as a secondary objective. The Fund seeks to achieve its investment objective by investing in a portfolio of exchange traded funds that produce income. These investments may be comprised of domestic and foreign securities, fixed income securities and any other debt or debt-related securities. The Fund may also invest in income producing equity securities of any market capitalization, including dividend paying common stocks, preferred stocks, and real estate investment trusts. The Fund may also invest in commodities.
There is no guarantee that any investment strategy will achieve its objectives, generate profits or avoid losses.


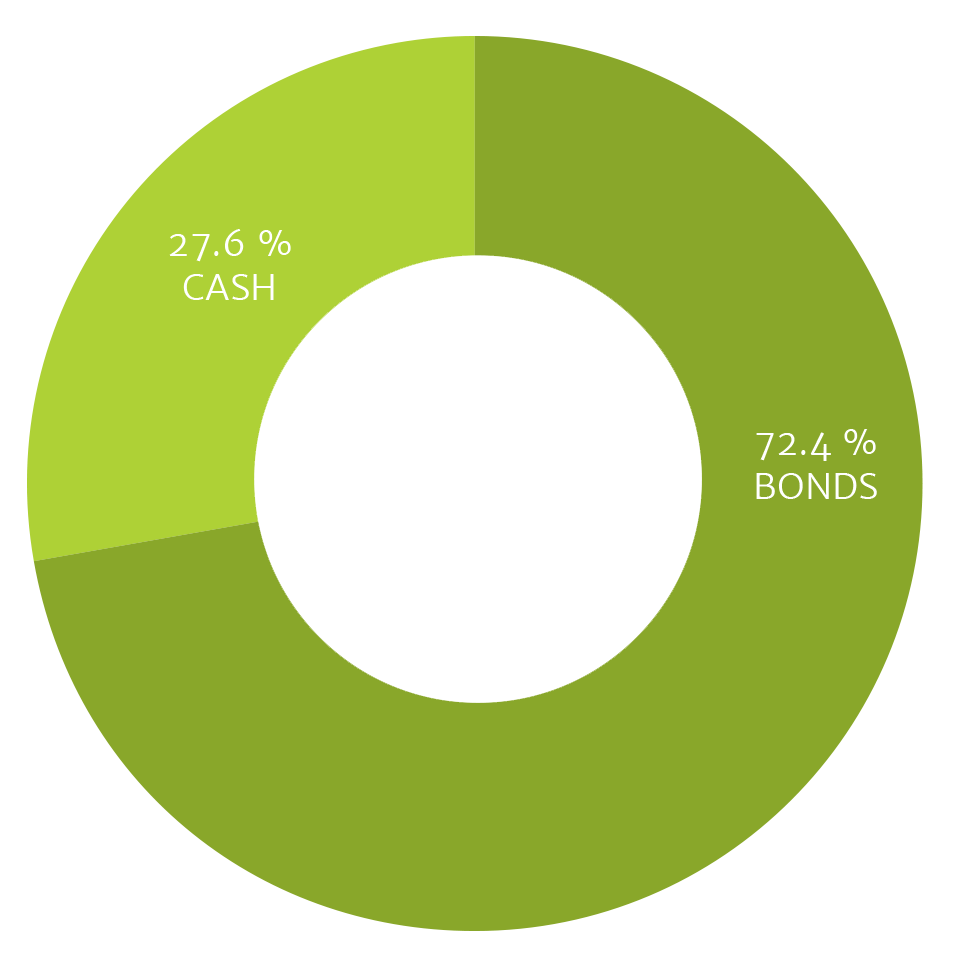
The Strategic Income Fund was created to provide a core "plus" exposure to fixed income. The Fund seeks a positive return through all bond market cycles with the ability to shift to defensive positions when bond markets decline. The fund is comprised of diversified mix of asset classes. The strategies are built using a mathematical optimization approach to construct a portfolio with the highest potential return per a targeted amount of portfolio risk. The strategy then uses a mathematical algorithm to rank securities and produce a well-diversified asset mix, suitable for the market cycle at hand. Each model sleeve has expected investment hold periods that are staggered to allow for constant adjustments in the fund throughout the year. Our process allows for quick responses to today’s constantly changing market conditions.
| NAV | NAV Daily Change | % Daily Change | % YTD Return | One Month | Three Months | Six Month |
|---|---|---|---|---|---|---|
| NAV6.92 | NAV Daily Change0.00 | % Daily Change0.00% | % YTD Return1.80% | 1 Month0.39% | 3 Months2.28% | 6 Months1.65% |
| Max Sales Charge | 1 Month-4.33% | 3 Month-2.60% | 6 Month-3.17% | |||
| One Yearthrough 3/31/2026 | Five Year THROUGH 3/31/2026 |
Since Inception THROUGH 3/31/2026 |
|
|---|---|---|---|
| -3.19 % | -4.87 % | -1.94 % | |
| Max Sales Charge | -7.83 % | -5.80 % | -2.33 % |
5.75% Max Sales Charge on Class A Shares. The performance data quoted here represents past performance. Current performance may be lower or higher than the performance data quoted above. Past performance is no guarantee of future results. The investment return and principal value of an investment will fluctuate so that investor's shares, when redeemed, may be worth more or less than their original cost. For performance information current to the most recent month-end, please call toll free 877-940-2526.
The Fund's adviser, RESQ Investment Partners, LLC (the “Adviser”) has contractually agreed to waive management fees and to make payments to limit Fund expenses, at least until February 1, 2027, so that the total annual fund operating expenses (excluding (i) any front-end or contingent deferred loads; (ii) brokerage fees and commissions; (iii) acquired fund fees and expenses, (iv) borrowing costs (such as interest and dividend expenses on securities sold short); (v) taxes; and (vi) extraordinary expenses, such as litigation expenses (which may include indemnification of Fund officers and Trustees, contractual indemnification of Fund service providers (other than the Adviser))) of the Fund do not exceed 2.20%, 1.80% and 2.80% of average daily net assets attributable to Class A, Class I, and Class C shares, respectively. These fee waivers and expense reimbursement are subject to possible recoupment from the Fund within three years after the fees have been waived or reimbursed, if such recoupment can be achieved within the lesser of the foregoing expense limits or the expense limits in place at the time of recapture. These agreements may be terminated only by the Board of Trustees on 60 days’ written notice to the Adviser.
As of:
3/31/26
| Security Description | Percentage |
|---|---|
| Desc. FRST AM-GV OB-X | % 22.86% |
| Desc. JPM ULTRA-SHT IN | % 11.45% |
| Desc. ISHARES 0-3M T/B | % 11.39% |
| Desc. ISHARES 1-3 YEAR | % 11.37% |
| Desc. ISHARES 0-1 YEAR | % 11.24% |
| Desc. VANGUARD SHORT-T | % 9.93% |
| Desc. ISHARES 20+YR TR | % 8.58% |
| Desc. SPDR-PORT L/T TR | % 8.48% |
| Desc. VANGUARD LT TREA | % 4.70% |
| Share Class | Ticker | CUSIP | Gross Expense Ratio | Net Expense Ratio |
|---|---|---|---|---|
| Share ClassA | TickerRQIAX | CUSIP66538E283 | GER2.76% | Net Expense Ratio2.371% |
| Share ClassI | TickerRQIIX | CUSIP66538E275 | GER2.36% | Net Expense Ratio1.971% |